A Quick-Check Guide To Meraki Dashboard Status

Table of Contents
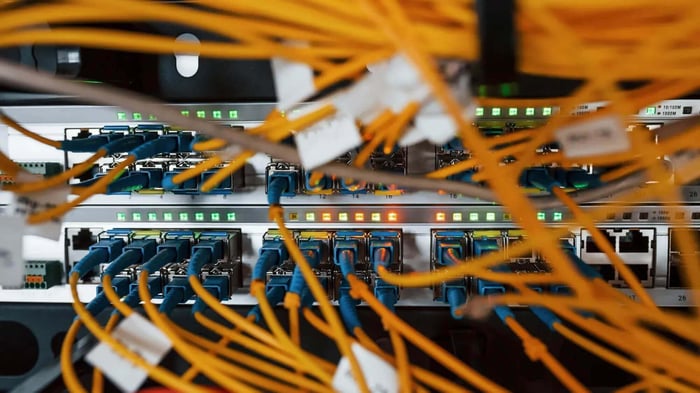
If you own the Meraki stack, the Meraki Dashboard status isn’t just “a tool.” It’s your central nervous system. When it’s healthy, life is good. When the dashboard feels slow or goes dark, your team’s tickets spike, and leadership wants answers yesterday.
This guide walks through how to closely monitor the Meraki dashboard status, what to do when the Meraki dashboard is down, and how to turn “What’s going on?” into a clear, repeatable process. It’s written for SMB IT teams who already know their way around Meraki and just want a clean playbook they can trust.
Using The Official Meraki Status Page Effectively
Most administrators are aware that the Meraki cloud status page exists. Fewer squeeze real value out of it. It’s easy to glance at a green indicator, shrug, and move on. The goal here is different: use the status page as a real diagnostic input, not just a “vibes check” to see if Meraki is up.
Think of the official status page as your source of truth for cloud-side issues. You’ll use it to confirm outages, subscribe to updates, and build a record of incidents you can show to non-technical stakeholders when they ask about reliability.
Subscribing To Proactive Incident Updates
The lowest-effort way to improve your Meraki monitoring is easy: just stop manually refreshing the status page.
Head to the official Meraki cloud status page and look for the option to subscribe to updates. Most modern status pages support:
Email updates: Good for small teams or solo admins who live in their inbox.
SMS alerts: Helpful for on-call rotations or after-hours coverage.
Webhooks: Best choice if you want alerts to land in Slack, Teams, or an incident system.
Set these up once, and you’ll hear about dashboard issues without anyone on your team babysitting a browser tab.
Reading The Component Status Breakdown
A green overall indicator doesn’t always mean everything works perfectly. The component breakdown is where the real signal lives.
You’ll usually see status for things like:
Dashboard UI: Page load, login, and general usability.
API: Health of calls from scripts, automations, or tools like Postman.
Region or service-specific entries: For example, specific shards/regions or cloud services tied to certain feature sets.
Pay close attention to partial incidents. You may see:
UI healthy, API degraded → Your automations fail, but admins can still log in.
Specific region degraded → One office reports issues, while other locations look fine.
This helps you determine if the issue matches what your users are seeing, or if you need to keep digging on the client side.
Reviewing Past Incident History
When leadership asks, “How stable is the Meraki dashboard really?” you need more than a gut feel.
Use the incident history on the status page to:
Identify patterns: Repeated API incidents during business hours, or UI issues clustered around a specific time window.
Support conversations with stakeholders: Instead of “it feels better lately,” you can say: “We’ve had one minor dashboard incident in the last 90 days.”
Improve your playbooks: If API issues are the usual problem, invest first in better alerting and retry logic for your integrations.
Screenshot or export incident history around big events and keep it with your internal outage notes. It’s useful evidence when you’re reviewing vendors or architecture choices.
Optimizing The UI For Better Readability
You’ll often troubleshoot Meraki issues late at night or during a crisis. Anything that reduces friction and eye strain helps.
A few quick wins:
Turn on dark mode in your browser or OS while working on the status page and dashboard. It’s easier on your eyes, especially on long calls.
Customize your main Meraki dashboard view so the most important networks and alerts show first.
Pin or bookmark the status page in the same folder as your other incident tools (RMM, RDP, monitoring UI).
Small UX tweaks don’t fix outages, but they lower the stress level when something breaks at the worst possible time.
Setting Up Proactive Meraki Dashboard Alerts
Relying on a status page alone is reactive. If your first indication of trouble is someone in finance saying, “The office Wi-Fi feels weird,” your monitoring is lagging behind reality.
You want Meraki to push your signal before users feel pain. That means spending a bit of time in the dashboard’s alert settings so you get the right noise level and the right channels.
Configuring Network And Organization-Wide Email Alerts
Inside the Meraki Dashboard, go to:
Network-wide → Alerts
From here you can:
Review the default alerts (device offline, connectivity issues, etc.).
Adjust thresholds and coverage for your environment.
Add or update recipient lists for different alert types.
Some practical patterns:
Send critical connectivity alerts to a shared IT group mailbox, not a single admin.
Reserve high-churn alerts (like client joins/leaves) for lab networks only.
Align alerts with your support hours and escalation paths; you don’t need noisy alerts at 2 a.m. that nobody responds to.
The goal: email alerts that are rare, relevant, and actionable. If people start auto-archiving them, your configuration needs another pass.
Sending Alerts To A Webhook For Slack Or Teams
Email alone doesn’t fit how many teams work now. If you already live in Slack or Microsoft Teams, bring Meraki alerts into the same channel.
High-level workflow:
Create an incoming webhook in Slack or Teams.
Copy the generated URL.
In the Meraki Dashboard alert settings, paste that URL into the webhook destination field.
Choose which alerts should go to chat (keep this list concise at first).
Why this matters:
On-call and ops teams see alerts alongside discussion and remediation steps.
You can easily thread conversations under a specific incident.
It’s easier to hand off between team members when everything lives in the same space.
Treat chat alerts like paging a human. If an alert doesn’t deserve that level of attention, it probably belongs in a report, not a channel.
Fine-Tuning Alert Thresholds To Reduce Noise
Alert fatigue kills monitoring. If everything is urgent, nothing is.
In the Meraki alert settings:
Tune device connectivity thresholds so you’re warned about meaningful downtime, not every brief blip.
Separate test/lab networks from production networks with different alert behavior.
Review alerts quarterly and remove anything that never changes your actions.
A simple test: for each alert type, ask, “If this fired at 2 p.m. on a Tuesday, would we do something differently?” If the answer is no, kill it or convert it into a periodic report instead.
Building Custom Checks With The Dashboard API
For many SMBs, Meraki’s built-in alerts are enough. Once you’re running multiple sites or integrating Meraki into a larger monitoring fabric, the API becomes the better long-term bet.
API checks let you treat Meraki dashboard status like any other monitored service: query, interpret, log, and alert based on response code and timing.
The API Endpoint For Organization Status
Meraki’s API provides endpoints that expose organization and service health. At a high level, you’ll:
Call the organization-level status or summary endpoint with your API key.
Expect a 200 OK HTTP response when the API is reachable.
Parse the response body for any service-specific flags (depending on the endpoint you choose).
For monitoring, you care about:
HTTP status code: 200 means “reachable and answering.” 5xx or timeout means “start worrying.”
Response time: If calls go from 200 ms to several seconds, something is straining either your path or Meraki’s side.
Once you’ve confirmed the endpoint and parameters in the official Meraki API docs, wire that into your existing monitoring stack.
A Simple Script To Query API Health
You don’t need a full-blown app to test Meraki API health. A short Python or PowerShell script does the job and plugs into most schedulers or monitoring tools.
Example Python-style logic:
Read the Meraki API key from an environment variable or secure store.
Call the status-related endpoint over HTTPS.
If the response code is 200, print or log “healthy.”
If not, exit with a non-zero code so your monitoring system can trigger an alert.
Once that’s working, run the script:
On a fixed schedule (every 1–5 minutes, depending on how sensitive you want it).
From a known-good network location, so your own firewalls or proxies don’t skew the results.
Now, if the Meraki dashboard is down or the API is unhealthy, your existing monitoring dashboard will light up just like it does for any other critical SaaS provider.
What To Do When The Meraki Dashboard Is Unreachable
At some point, you’ll type dashboard.meraki.com, and… nothing. The key is to treat this like any other incident, not a panic button.
Start with a calm, repeatable checklist. You want to know quickly whether the issue is:
Your local environment
Your ISP or upstream path
Meraki’s cloud
Rule Out Your Local Network As The Problem
Step one: make sure you’re not chasing a problem that lives entirely on your side.
Quick checks:
Can you access other external websites reliably?
Is the problem isolated to one machine or visible across multiple devices?
Does switching from wired to wireless (or vice versa) change anything?
If only one client is affected, you’re looking at browser, OS, VPN, or local security software. If multiple subnets and VLANs see the issue, start zooming out toward the WAN and ISP.
Check Community Channels For Real-Time Outage Reports
Official status pages sometimes lag real-world impact. Admin communities don’t.
When you suspect a wider Meraki issue:
Check community forums, Reddit, or X (Twitter) for “meraki dashboard down” and recent timestamps.
Look for multiple reports across regions and ISPs, not just one loud voice.
If half the planet is yelling about dashboard access, your next steps shift from “internal troubleshooting” to “communicating impact and waiting on the vendor,” with your own checks still running in the background.
Access Local Status Pages On MX Devices
If the cloud is unreachable but your MX appliances still pass traffic, use the local status page on an MX to see what’s going on.
Typical flow:
From a device behind the MX, browse to the MX’s local IP (for example, the default gateway).
Authenticate if prompted.
Check WAN status, DNS settings, and connectivity tests from the MX’s point of view.
This tells you whether the MX can reach the internet, resolve hostnames, and maintain tunnels even while you can’t reach the Meraki Dashboard itself.
Diagnosing Client-Side vs. Cloud-Side Issues
This is the classic “Is it us or them?” question. You want a quick way to separate local issues from Meraki-side trouble without jumping to conclusions.
Build a simple runbook that you or anyone on the team can follow under pressure.
Running A Traceroute To The Dashboard
Traceroute gives you a hop-by-hop view between your client and Meraki.
Basic steps:
From a client, run tracert dashboard.meraki.com (Windows) or traceroute dashboard.meraki.com (macOS/Linux).
Watch where the path fails or spikes.
If the trace dies at:
Your default gateway – Examine your own routing, firewall, or SD-WAN.
Your ISP’s early hops – Open a ticket or check for their status updates.
A hop close to Meraki’s infrastructure – Combine this with status page info to build a stronger case for a cloud-side issue.
Keep screenshots or saved outputs for incident notes and future patterns.
Checking For DNS Resolution Problems
Sometimes the dashboard is fine, but DNS isn’t.
Try:
nslookup dashboard.meraki.com against your internal DNS.
The same command pointing to a public resolver like 8.8.8.8.
If internal DNS fails but public DNS works:
You likely have a split-horizon DNS or internal forwarder issue.
Fix or bypass that, and your Meraki access returns without involving the vendor.
If both resolvers fail, you may be dealing with a larger upstream DNS event or connectivity problem that reaches beyond Meraki.
Isolating A Single Client Or The Whole Network
You don’t want to overreact to a problem that affects one user’s laptop.
Build a quick blast-radius checklist:
Can multiple users on different subnets reach the dashboard?
Do both wired and wireless clients show the same symptom?
Does the issue appear from a different site or via VPN?
If only one client fails, stay in the weeds: browser cache, certificates, proxies, endpoint security. If entire sites fail, zoom out to WAN, ISP, or Meraki-side investigation.
Turn Dashboard Panic Into A Proactive Procedure
Meraki provides strong cloud management capabilities, but that only helps if you treat dashboard health like any other critical service. With the right mix of status page usage, alerts, API checks, and basic network troubleshooting, “Is Meraki down?” becomes a quick question to answer, not an all-hands fire drill.
Here’s the bottom line for busy IT teams:
Subscribe to the official Meraki status page and use the incident history when you talk to stakeholders.
Build lean email and webhook alerts so the right people hear about issues quickly without drowning in noise.
Add API-based checks into your existing monitoring so Meraki behaves like any other first-class monitored service.
Use clear, repeatable diagnostic steps, traceroute, DNS checks, and MX local status, to decide if you’re looking at a local issue or a cloud-side incident.
A solid monitoring plan deserves a professionally installed network. Hummingbird Networks designs, configures, and installs Cisco and Meraki environments so your team can focus on performance, uptime, and the projects that move the business forward — not chasing mystery outages at 3 a.m.
A solid monitoring plan deserves a professionally installed network. We handle the configuration and installation so you can focus on performance.
FAQs
How can I check the current Meraki dashboard status?
You can check the official Meraki status page to view service health, incident updates, and the status of dashboard and API components.
What should I do if the Meraki dashboard is unreachable?
Start by verifying local connectivity, checking DNS resolution, reviewing the Meraki status page, and testing access from multiple devices or locations.
Can I monitor Meraki dashboard health automatically?